
The TCx Portal is where you design, order, and manage a service. Everything from creating an order, designing a solution, tracking the order and configuring different portions of solution happens inside TCx Portal.
What this is
An orientation, not a click-by-click script – the exact ordering steps are on the IZO™+ Multi Cloud Connect Direct and IZO™+ Multi Cloud Connect Flex order pages. This shows how the portal is laid out so the rest of the section reads as a map you already recognise.
After you sign in: The Dashboard
Signing in opens your Dashboard, with a left-hand navigation sidebar (“Your Modules”) and summary cards (Orders, Active services, Inventory by region, Planned Maintenance, and more). The sidebar is how you move around the portal.
Depending upon, which landing page you are coming from, you might see different pages upon login. Below are two post-login pages:
Dashboard 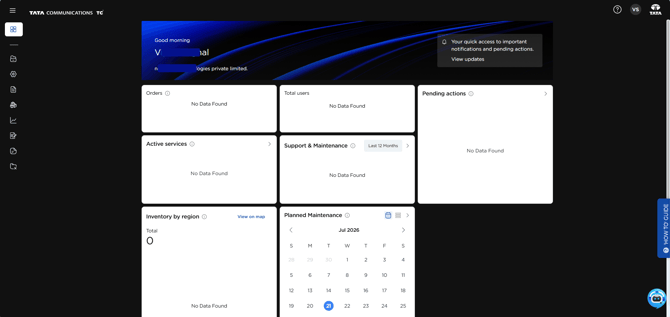
Ordering Page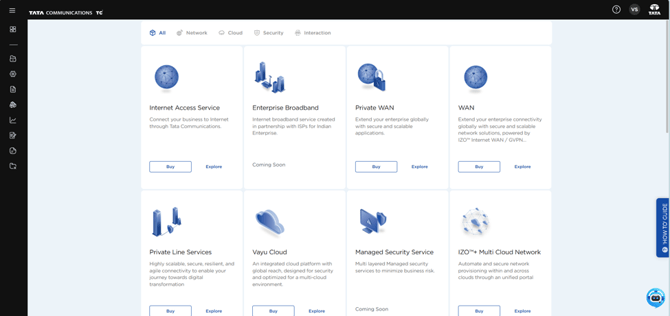
Left Sidebar Menu
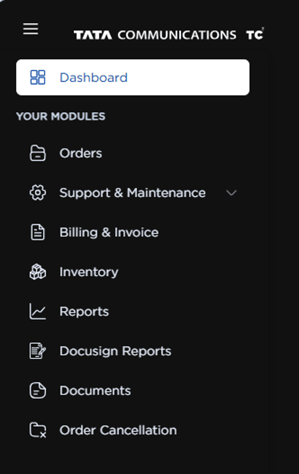
The sidebar modules
-
Dashboard – the landing overview.
-
Orders – place and track orders. This is where a new service starts (see below).
-
Support & Maintenance – raise and follow incidents and requests.
-
Billing & Invoice – charges and invoices (see Section 11).
-
Inventory – your live components, and where you run Get Network Config to retrieve the addressing for the cloud and CPE sides.
-
Reports – utilisation, availability, and other reports (see Section 11).
-
Docusign Reports – your signed order documents.
-
Documents – service documentation.
-
Order Cancellation – request termination of a live service (see Section 11).
Where a service is ordered
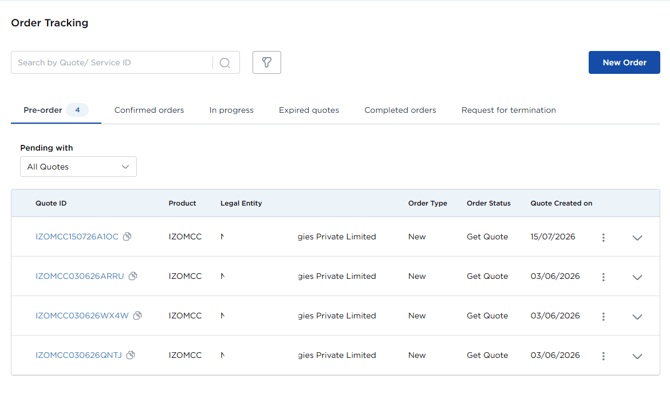
Ordering starts from Orders, which opens the Order Tracking screen. From there, New Order (top-right) begins a new service. The Order Tracking screen also lists your existing orders across tabs – Pre-order, Confirmed orders, In progress, Expired quotes, Completed orders, Request for termination – which is how you follow an order’s status (see Order Tracking & Status).
The Connection, Fabric Edge, Fabric Port, and Solutions menus are not on the Dashboard – they appear along the top once you are inside a solution on the design canvas (after you start a New Order and choose an on-ramp). That is where you drag and configure each component; the portal validates each one as you go.